


On the Frontlines: The Illusion of Efficiency
Blogs Sadat Shams, IAP, PRINCE2, IRCA Certified Lead Auditor Feb 09, 2026

In the corporate world, numbers reign supreme. They are the center of most discussion points of every meeting, big or small. While we rely on numbers to reveal the truth, they can also be engineered to hide the truth, especially when incentives reward the wrong behaviors.
This was the case at the European Chocolate Manufacturing Corporation Ltd., a multinational consumer goods company operating in 11 countries (All details have been changed to protect the privacy of the real organization).
One of European Chocolate’s facilities, located in Samoa, was being audited. The Samoa location had been reporting stellar and progressive overall equipment effectiveness (OEE) numbers for years and the plant had been operating above 85% OEE for a couple of years. This was despite operating with aging machinery and unskilled manpower.
On the surface, it was a case study in manufacturing excellence. However, as the internal auditors quickly learned, efficiency is only as real as the controls and culture that support it.
The Case: Too Good to Be True
European Chocolate’s Samoa plant had earned accolades globally for consistently hitting high production numbers and OEE. Machines well past their prime were reportedly operating at near-optimal efficiency. Waste figures were low, and production outputs appeared to defy the facility’s physical limitations.
Reported highlights included:
Item
Average Machine Outputs
Reported Waste
OEE
Reported
~3 million units per 8-hour shift
<2%
>85%
The Samoa-based production team were known as the Operations Excellence Leaders across the European Chocolate Manufacturing Group, with multiple production team leaders getting promotions, awards, and even positions in other European Chocolate plants as international assignees. In fact, they were earning extra credits (and incentives, of course) by becoming trainers for other manufacturing facilities around the world.
When the internal audit team stepped in, the plant was oozing with confidence, basking in glory. Internal audit’s initial role aligned with the third line in the governance structure: to provide independent and objective assurance.
Peeling Back the Layers
Red Flag 1: SCADA vs. Reality
- Machine-level supervisory control and data acquisition (SCADA) and PLC logs revealed actual waste in the range of 5~8%, significantly above the reported 2%.
- Three not-required-to-run (NRR) machines were found generating waste or defects for up to six hours per day, but the production logs in their PLC were wiped clean.
What was the production team’s response?
- The PLC logs were defective and were not capturing true waste/defect.
- The NRR machines were dry run for six hours by production team leaders as a regular practice.
- Only the manual data were correct.
When asked if the production team had communicated with the equipment manufacturer regarding this alleged “machine waste recording defect,” they had no answer, of course. Moreover, there were no recent calibration logs or maintenance records for the waste-monitoring sensors.
Red Flag 2: Misaligned KPIs
Bonuses were linked directly to reported OEE figures. This misalignment had created a culture where manipulating data seemed less like a violation and more like a shortcut to recognition. Moreover, the second line didn’t have any KPI linked to accuracy of reporting. On top of that, they didn’t have the access to the machine’s PLC logs either.
Where the Three Lines Broke Down
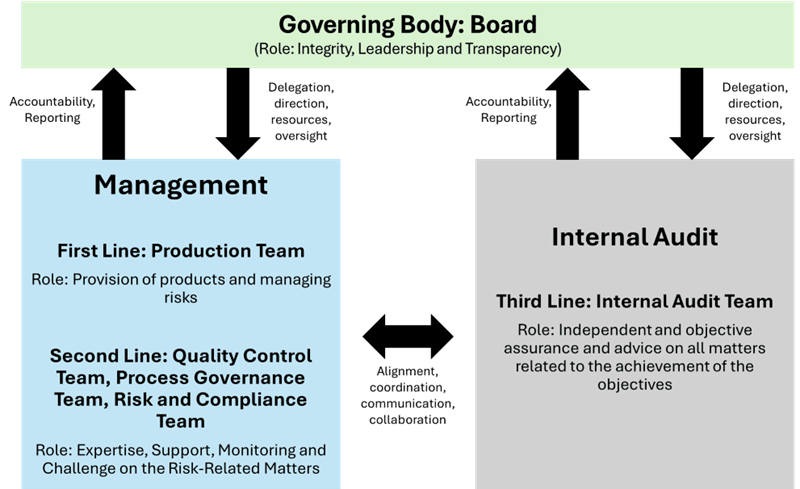 Figure 1 The Three Lines Model
The first line (Production Team) focused on achieving the output goals but compromised accuracy and transparency in reporting.
The second line (QC and Process Governance) were responsible for oversight but lacked authority or accountability to detect deeper process issues.
The third line (internal audit) uncovered the gap and held up a mirror to a flawed system. What emerged was a classic failure of coordination, accountability, and culture.
Root Causes:
People:
- Performance incentives driving data tampering.
- Minimal accountability across functions.
Process:
- Fragmented systems with no unified data trail.
- No preventive controls on untracked machines.
- Oversight limited to paperwork, not process.
The Fallout
The response was swift and focused on reinforcing all three lines. The board triggered an investigation on suspicion of potential fraud, while suspending all performance-based incentives, pending results. Nine employees were found to have been involved in fraud and collusion, and disciplinary actions were taken according to labor law.
A centralized production operations management system was introduced to unify data across machines, while access controls and digital forensics were deployed to prevent future manipulation. Training was rolled out, focusing on ethics, transparency, and internal controls, with the second line empowered with oversight. Internal audit focused on continuous auditing to ensure all controls were in place.
At the end of the day, this audit served as a powerful reminder:
“What gets measured gets managed, but what gets rewarded gets manipulated.”
The audit didn’t just uncover falsified data. It uncovered a cultural blind spot — a belief that if the numbers look good, the reality behind them didn’t matter.
Learn more with our other resources
Articles
EPA Climate Rollback
Articles
Fraud: The Heartbreaking Fraud
Articles
Basics: Persuasive Results
Articles